Tuesday, 22 September 2015

Data Warehouse Fact Tables and Column Store Indexes


In modern distributed database environments, it has become clear that the weak link, from a performance stand point, is the IO subsystem.  RAM and CPU speeds and reached impressive performance levels but the data access levels have not kept up with those of RAM or CPU.  

This represents a real problem for users of databases and a lost opportunity to keep database management systems, as we know them, a viable tool in a world of exponential data growth.  People simply will not put up with less than optimal performance in today’s fast pace digital world.

The engineers at Microsoft recognized this and introduced the column store index.  The column store index has proven to be incredibly fast for a high percentage of data warehouse queries specifically those targeting large fact tables which are where all the juicy meat is in a data warehouse.

Row Store and Column Store

A traditional B-tree structure in clustered and non-clustered indexes is based on a physical layout of data called a row store.  Simply put data is stored in data pages in your standard spreadsheet type of rows.  A column store turns this all on its head and stores data in a column oriented layout. 

Here is a simple graphic of the differences: (thank you http://arxtecture.com/ for this graphic)


Read what you need

This all seems like a simple enough concept but when you examine what this difference in physical layout really means performance it is actually quite amazing.

If you are querying only a subset of the data from a table and you specify the individual columns then you pull out only the requested data into memory and leave the rest behind.  This is a huge IO savings.

Compression

Also, Microsoft used a very aggressive compression technology from Vertipaq and this technology is hugely effective when using a column based physical layout.  For example:  suppose you have a column such as gender and you only have a handful of possible values.  This type of column that has very low selectivity is an ideal candidate for a high degree of compression.  If you had a fact table with many rows like this and you applied a highly aggressive compression ratio to it you again are decreasing the IO and increasing the performance times.

Ideal for data warehouse fact tables

In today’s modern data warehouses that use traditional star and snow flake schemas, it is not uncommon for fact tables to be incredibly large.  In order to provide a high level of aggregation of the more granular fact details, queries against fact tables are usually range based and implement a lot of scanning, sorting and aggregating of the data.  If the data is stored in a column based physical layout then the savings of IO that come from there being more necessary data per page read into memory, more efficient levels of compression and better memory buffer usage really begins to add up fast.  These benefits combined with the new batch model that the query optimizer offers can increase performance by up to 10x and sometimes up to 100x according to a Microsoft white paper called ‘Enhancements to SQL Server Column Stores.’

There are of course limitations and best practices that should be considered as well so be sure to look into those before you go changing all your indexes into column store indexes.

Thanks for reading,


SQL Canuck

Thursday, 17 September 2015

The Executioner - how is a deadlock victim chosen?

As database professionals we have all read at least a little bit about locks that the database engine uses.  The word locks in database engines have sort of become a swear word but unfairly.  Maybe because locks sounds like blocks we tend to think of locks as a bad thing when really it isn’t.  It is locks that ensure that our data remains consistent which of course is the C in A-C-I-D which of course is essential in ensuring an RDBMS is a viable solution.

The purpose of this blog is not to once again go over all the types of locks because there is plenty of material out there for that but to talk about something that I never really thought about much in the past.  This has to do with the dreaded deadlock.  Again, as database professionals, Im sure we have all seen the classic example of the deadlock.

Ill go over it quickly so we are all on the same page:
  • Transaction 1 gets a shared lock on a row.  
  • Transaction 2 gets a shared lock on a different row.
  • Transaction 1 asks for an exclusive lock on the other row but is blocked by the shared lock that Transaction 2 has on it.
  • Transaction 2 ask for an exclusive lock on the other row but is blocked by the shared lock that Transaction 1 has on it
  •  Transaction 1 can’t finish until Transaction 2 finishes but  Transaction 2 can’t finish because it is blocked by Transaction 1. 


-Technet


Now the reason I have chosen this topic is because recently an SSIS project that I support failed over night and when I examined the All Executions report found in the Information Services Catalogs node of SSMS, I discovered from the error messages that my package had been the victim of a deadlock that was detected.  The error message goes like this: 

Fix : Error 1205 : Transaction (Process ID) was deadlocked on resources with another process and has been chosen as the deadlock victim. Rerun the transaction.

I’d never really given it much thought about how it had been chosen as a victim but having recently passed my Oracle Certified Associate certification, I had read a lot about all the various processes that run in an Oracle instance and perform a variety of jobs.  So it occurred to me that there must be a similar type of process that is running automatically in Sql Server that handles deadlock situations so I did a quick google and looked it up.

There is indeed a dedicated thread that performs deadlock detection. 

The following is from Technet:

'Deadlock detection is performed by a lock monitor thread that periodically initiates a search through all of the tasks in an instance of the Database Engine. The following points describe the search process:
  • The default interval is 5 seconds.
  • If the lock monitor thread finds deadlocks, the deadlock detection interval will drop from 5 seconds to as low as 100 milliseconds depending on the frequency of deadlocks.
  • If the lock monitor thread stops finding deadlocks, the Database Engine increases the intervals between searches to 5 seconds.
  • If a deadlock has just been detected, it is assumed that the next threads that must wait for a lock are entering the deadlock cycle. The first couple of lock waits after a deadlock has been detected will immediately trigger a deadlock search rather than wait for the next deadlock detection interval. For example, if the current interval is 5 seconds, and a deadlock was just detected, the next lock wait will kick off the deadlock detector immediately. If this lock wait is part of a deadlock, it will be detected right away rather than during next deadlock search.

By default, the Database Engine chooses as the deadlock victim the session running the transaction that is least expensive to roll back. Alternatively, a user can specify the priority of sessions in a deadlock situation using the SET DEADLOCK_PRIORITY statement. DEADLOCK_PRIORITY can be set to LOW, NORMAL, or HIGH, or alternatively can be set to any integer value in the range (-10 to 10). The deadlock priority defaults to NORMAL.'

So if you are the victim of a deadlock anytime soon you will know you aren't being picked on because Sql Server just doesn't like you but there is a good reason for it and it wasn't just an unfair random occurrence.

Thanks for reading,


SQL Canuck

Tuesday, 8 September 2015

Resource Governor - learn it FULLY before you use it or suffer possible consequences.

Throughout many of my blog posts I talk about how I feel putting in the time to fully study certification material really pays off by filling out the breadth of your knowledge of the SQL Server products.  I came across a situation recently that really demonstrated this and I would like to share it with you.

It is easy as IT professionals to jump to conclusions about the functionality of areas of the product when in fact it may not be as intuitive as you may think. 

Recently, we came across a situation where our test environment was really struggling to perform.  We thought maybe it was because of the concurrent workloads we were asking it to handle but that didn’t really make sense since in the past it handled many different volumes with no problem.

After some investigation, it was discovered that an erroneously configured Resource Governor set up was the culprit.  Resource Governor is a simple enough concept but there a few different components that must be setup properly.  It needs a resource pool, a workload group and a workload classifier function to all be set up correctly or the outcome can be very serious if you are unnecessarily throttling CPU or RAM or both.

Let me explain what happened.  An ETL developer suggested a Resource Governor set up so that when they run a job that rebuilds indexes they won’t hog the resources from the other ETL developers. That was a kind innocent enough gesture.  

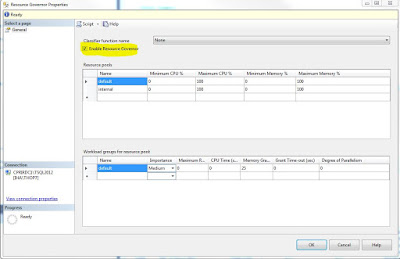
So the first thing the sysadmin did was to enable  Resource Governor which makes sense.


Then they thought that if they set the Maximum CPU to 50% on the default resource pool for a limited amount of time, the developer could rebuild the indexes without hogging all the resources.


I believe the thinking was it was not possible to build a classifier function for some reason for this purpose so if they set the default to 50% for a limited time and then when they were done to return the system to normal.

When the developer was finished the rebuilding the sysadmin went in and clicked on the ‘Enable Resource Governor’ check box  to disable it thereby returning the system to how they found it.

So to summarize, the thought was if they enabled Resource Governor and lowered the default CPU to 50% and then later disabled the Resource Governor it would return the CPU to 100%. 

What they discovered, weeks later full of frustration at the decreased performance of the test server, was that disabling Resource Governor without setting the default CPU back to 100% would effectively limit all users of resources in the system to only 50%.  Simply disabling Resource Governor may not do what you think it does.  It isn’t quite that simple.

My point is that if they read more material about how Resource Governor really works and the importance of correctly using all the components together including a classifier function and also what the ‘default’ resource pool really is, then perhaps weeks of frustration could have been avoided.

Of course, I have the benefit of hindsight...:)  

Thanks for reading,


SQL Canuck